
an initiative by SEEK Development
Partner Perspective
0 min read
Better Aid Scorecards
Written by
Jorge Rivera
Published on
December 13, 2019
By Jorge Rivera, ONE
How well do donors adhere to commitments on development assistance? Are they funding projects in the neediest sectors? The Donor Tracker provides information on the Organisation for Economic Cooperation and Development (OECD) Development Assistance Committee (DAC) donors’ strategic priorities, and now ONE’s new Better Aid Scorecards can help readers track countries’ progress on development financing across specific metrics. The Better Aid Scorecards complement Donor Tracker analyses by specifically assessing countries’ actions towards ending extreme poverty and gender inequalities, helping to clarify where donors are stepping up, and where they are falling behind.
How much official development assistance do donors provide, and how effectively are they spending it? The answers to these questions are not as easy to discern as they ought to be. Accessing and analyzing development finance statistics often requires specialized technical knowledge. Answers are sometimes buried in long reports or complicated by jargon.
After more than ten years of publishing our flagship DATA Report, which aimed to paint a yearly picture of the state of development finance and to hold governments accountable, we set out to build a new advocacy tool. This September, we launched the Better Aid Scorecards, which are designed to enable advocates, campaigners, and citizens to track countries’ progress on official development assistance (ODA) financing.
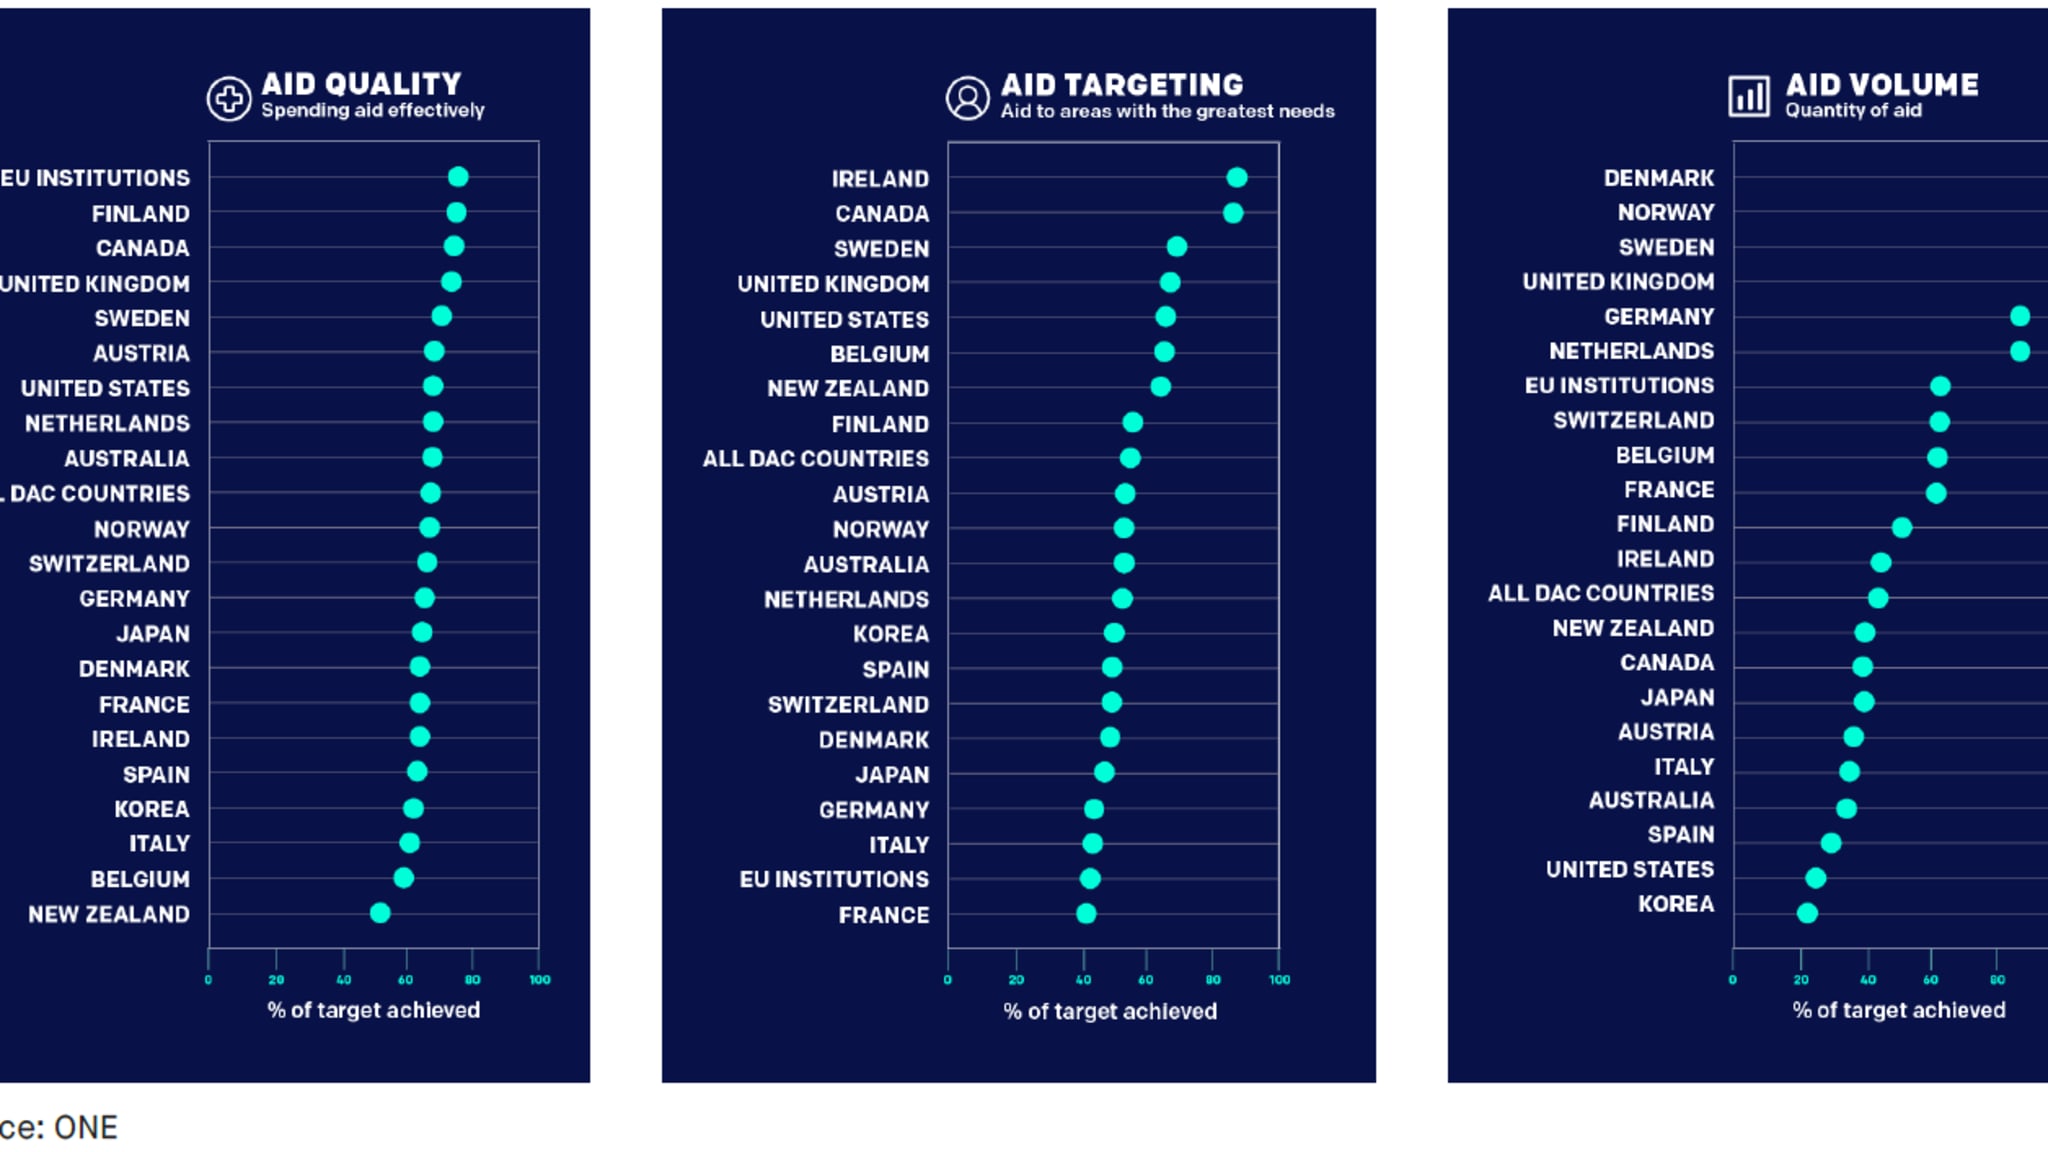
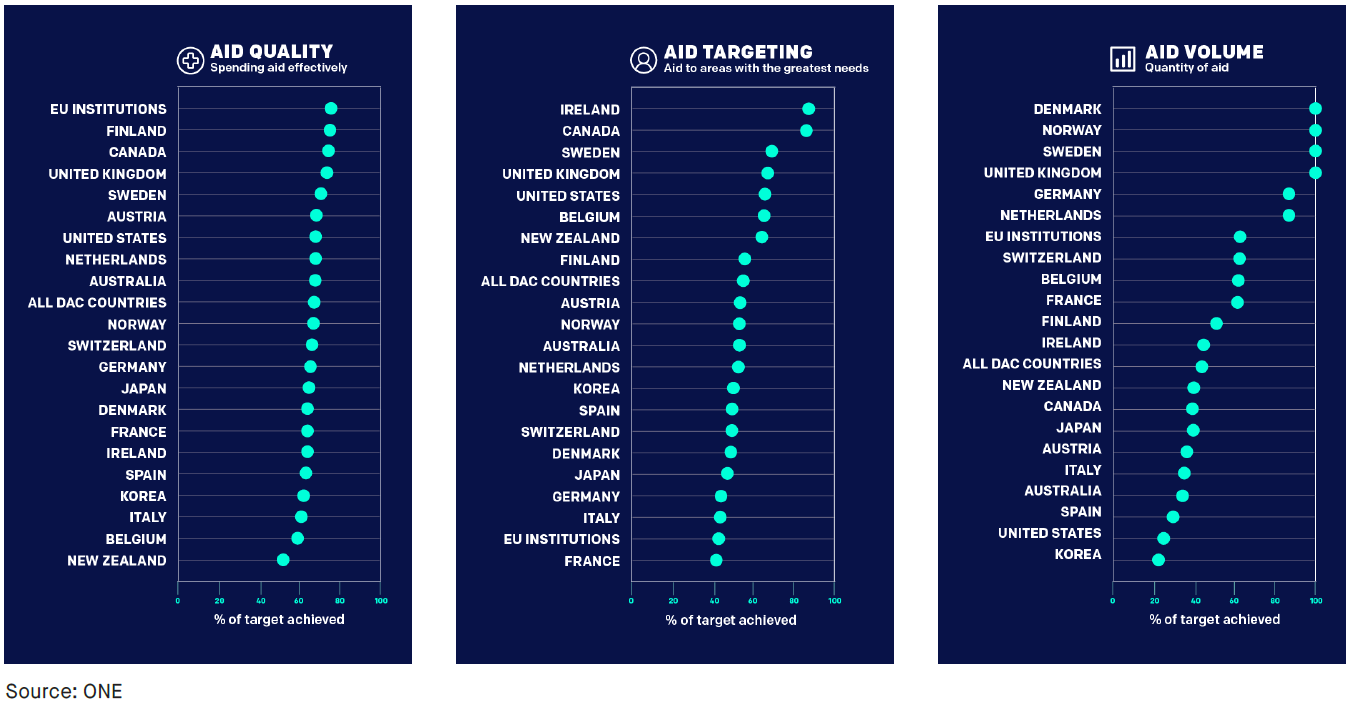
The Scorecards use seven indicators, grouped into pillars (quantity, targeting, and quality), to evaluate, grade, and rank donors. For each indicator, donor performance is assessed against a combination of international commitments and policy advocacy targets. The Scorecards focus on the 20 largest bilateral donors, plus major European institutions, to answer two basic questions:
- How much development assistance are donors providing?
- Does it target the people and places most in need?
Major donors are falling behind
The IMF estimates that by 2030 there will be a funding gap of US$358 billion per year in low-income countries. Donors have been making commitments to international development for decades. Yet, as the Scorecards highlight, it is smaller donors – the UK is the only exception – which are leaders in terms of their financing effort.
In 2018, Sweden, Luxembourg, Norway, Denmark, and the UK all provided at least 0.7% of their gross national income (GNI) as ODA, making good on an EU-wide promise dating back to 2005.
Yet overall, most donors are not even close to meeting the decades-old ODA to GNI commitment. In 2018 alone, if all thirty of OECD’s Development Assistance Committee (DAC) donors had met the 0.7% target, there would have been an additional US$196 billion available in global development funding, a staggering 228% more than was actually provided.
Some of the world’s largest economies, including the US (0.17%), Germany (0.61%), Japan (0.28%), Canada (0.28%), and France (0.43%), make large financial contributions each year to international development. But the sums that they provide, when compared to their national wealth (GNI), are not up to the major financing challenge we face.
Decreased impact
One of the indicators assessed by the Better Aid Scorecards is the share of total ODA spent in the Least Developed Countries (LDCs). We use spending in this category as a proxy for donors’ prioritization of the poorest countries with the greatest need.
LDCs face formidable challenges accessing all forms of development finance. In 2017 they received only 29% of DAC donors’ total funding.
Some donors do prioritize reaching the poorest countries; Ireland and Japan direct 43% and 44% of their development funding to LDCs, respectively. But other donors fund LDC-specific projects at much lower levels: Germany at 16%, Italy at 20%, and the Netherlands at 21%.
Looking at target sectors, unfortunately, the story is not much better. The Scorecards track spending on health, education, and social protection in low-income countries. Analysis of spending in these specific sectors captures whether donors prioritize human capital investments which protect and elevate the vulnerable.
In 2017, investment in these sectors was a mere 32% of total ODA, meaning that two out of three development dollars are spent elsewhere. Here again, the Scorecards show which donors are leaders in this regard and which are not. For example, while the US invests well over half of its ODA in these sectors, Italy spent three times more ODA on in-country refugee costs than on health, education, and social protection combined.
Gender-blind development funding
Gender equality is a critical area of development spending, which some donors clearly prioritize. Sweden spends 84% of its ODA on gender-responsive programs. Ireland spends 83% and Canada 80%. Yet the Scorecards highlight how far most donors really are from ensuring their development assistance contributes to gender equality. In 2017, only 36% of DAC donors’ total ODA was spent on gender-responsive programs.
On this front, too, large donors such as France, the US, and the EU Institutions trail behind; they all spend over two-thirds of their bilateral development assistance on gender-blind programs.
Gender-blind programs (programs with no explicit mission to reduce gender inequality or to meet gender-specific needs) are less effective. They are not likely to equally benefit the most vulnerable. Projects that are gender-responsive simply do a better job of making sure that pre-existing inequalities are considered from the start, so that they can be more effectively addressed.
Where do we go from here?
Significant improvement is needed in the efficiency of ODA spending, as well as the sustainability and efficacy of supporting low-income countries in building systems that allow governments to drive their own development in the long term.
To maximize impact, funding must be targeted to the people, places, and sectors with the greatest need. At a time when donors are prioritizing domestic ODA spending or focusing on mobilizing private sector financing, the Scorecards show that donors must do better when it comes to the fundamental purpose of development assistance.
ONE has a long history of pushing for ambitious commitments in the fight against poverty and of following up with data-driven tools to ensure accountability. We hope the Better Aid Scorecards will make it easier for others to hold their governments to account and to show where they are moving forward and where they are falling behind.

Jorge Rivera
Related Publications
Be the first to know. Get our expert analyses directly in your inbox.
Our team of country experts and analysts regularly bring you fresh content to help you drive impact.
By clicking Sign Up you're confirming that you agree with our Terms and Conditions .
SEEK Development
The Donor Tracker is an initiative by SEEK DevelopmentContact
SEEK DevelopmentCotheniusstrasse 310407 BerlinGermany