
an initiative by SEEK Development
Partner Perspective
0 min read
Quality of ODA is as important as quantity
Written by
Ian Mitchell, Samuel Hughes
Published on
June 16, 2021
As advocates for global development will know, the quantity of official development assistance (ODA) is often a major determining factor in its effectiveness, but the quality of that finance also matters hugely. Will donors’ development finance be targeted where it is needed most? Will it achieve the ownership and support of the recipient country? Will it be provided transparently so that recipients and taxpayers can scrutinize it? And will it be properly evaluated? These are the questions posed by the Center for Global Development’s (CGD’s) Quality of Official Development Assistance tool, QuODA.
While the Donor Tracker monitors the policy and spending of the 14 largest providers of official development assistance, QuODA provides a suite of indicators that assess the quality of those efforts for the country providers and multilateral organizations that disperse the most ODA. Using QuODA and the Donor Tracker together, readers can comprehensively monitor the size, scope, and effectiveness of major donors’ ODA policies and spending.
Readers can view the QuODA results for each country and agency assessed here, and a discussion of the results at a Donor Tracker-hosted event here.
Reaffirming ODA effectiveness
The principles of ODA effectiveness were the focus of a series of high-profile, international meetings starting in the 2000s. Policymakers believed that by agreeing upon common principles and norms, providers could collectively up their game in ODA effectiveness. These efforts culminated in the Busan Agreement in 2011, which established the Global Partnership for Effective Development Cooperation, an ongoing initiative to drive development effectiveness whose flagship ‘monitoring exercise’ is a crucial survey of recipients' views of ODA provider projects (which CGD used extensively in the development of QuODA). Still, many commentators feel that donors’ commitment to effectiveness principles has plateaued and that this agenda has lost momentum on the international stage.
Yet with some of the most important providers of ODA slashing their development budgets to focus discretionary resources on domestic pandemic recovery, even as the number of people living in extreme poverty is expected to rise for the first time since 1998, spurred by the pandemic. As many low-income countries are still fighting dramatic viral surges and reeling from the economic aftershocks, it is perhaps more important than ever that what funding ODA donors do provide be implemented effectively.
Be the first to know. Get the latest in development news, right in your inbox.
The Donor Tracker team and network of in-country experts help advocates drive sustainable impact with regular Policy Updates, data-driven analyses, and the most important news in the world of development.
By clicking Sign Up you're confirming that you agree with our Terms and Conditions.
an initiative by SEEK Development
Methodology
QuODA assesses the largest 49 bilateral and multilateral development finance providers across a set of common indicators to enable comparison and encourage improvement. It looks at four dimensions of quality: prioritization; ownership; transparency and untying; and evaluation. CGD encourages readers to use these results to motivate and challenge their country’s lead ODA agency to do better - and early exchanges with officials in several countries and agencies suggest that users are doing just that. While QuODA is a useful tool in pursuing policies for future ODA effectiveness, CGD has also retrospectively analyzed total global ODA over the last decade to assess progress over time and to identify trends in the effectiveness of donors’ development finance.
Figure 1: QuODA Dimensions
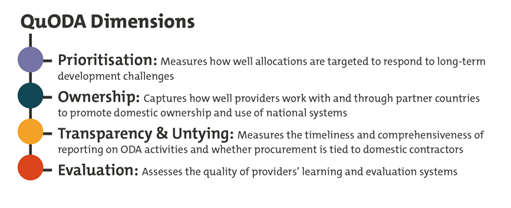
Prioritization
The graph below depicts trends based on two of QuODA’s indicators: the share of assistance received by partner countries (the balance being spent on areas including administrative costs, refugee hosting, student bursaries...etc.) and average income level of development partners. We might expect the average income level to rise over time due to economic growth, but we should also expect providers to redirect their development spending towards the poorer countries left behind.
Figure 2: Share of ODA Reaching Recipient Countries
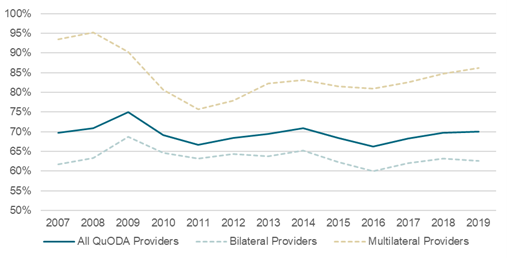
Source: Authors’ calculations, based on the OECD Creditor Reporting System and Country Programmable Aid datasets, see methodology (P1) for full details.
Figure 3: Average GNI per capita of ODA Recipients (2017 USD, PPP)
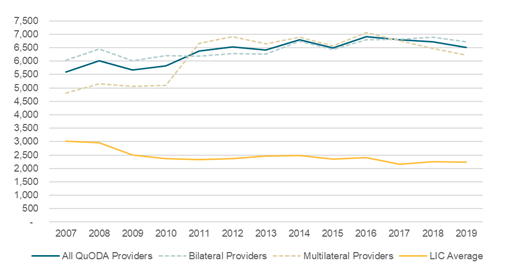
Source: Authors’ calculations, using the World Bank’s WDI database, CIA World Factbook, and OECD CRS database.
The data show two concerning trends, however: the share of ODA reaching partner countries has flatlined at around 70% over the past decade (2010-2019) and the average income of those reached with this assistance has also shown little overall movement. Worryingly, the average income level has consistently remained more than double the low-income country average, meaning that the poorest countries are being passed over for the bulk of providers’ ODA.
Ownership
Ownership is, for many, the most important principle of ODA effectiveness. The first principle of the Global Partnership for Effective Development Cooperation is that development efforts can only succeed if they are “led by developing countries, implementing approaches that are tailored to country-specific situations and needs”. The last year and a half have illustrated how important it is that low-income governments be able to respond flexibly to emergencies on the ground. As the pandemic raged, new priorities requiring local decision-making on resource allocation suddenly emerged, illustrating the importance of country ownership. The resources over which low-income countries had full control and ownership were most quickly accessible and flexibly applicable in a moment of true crisis and unforseen challenges.
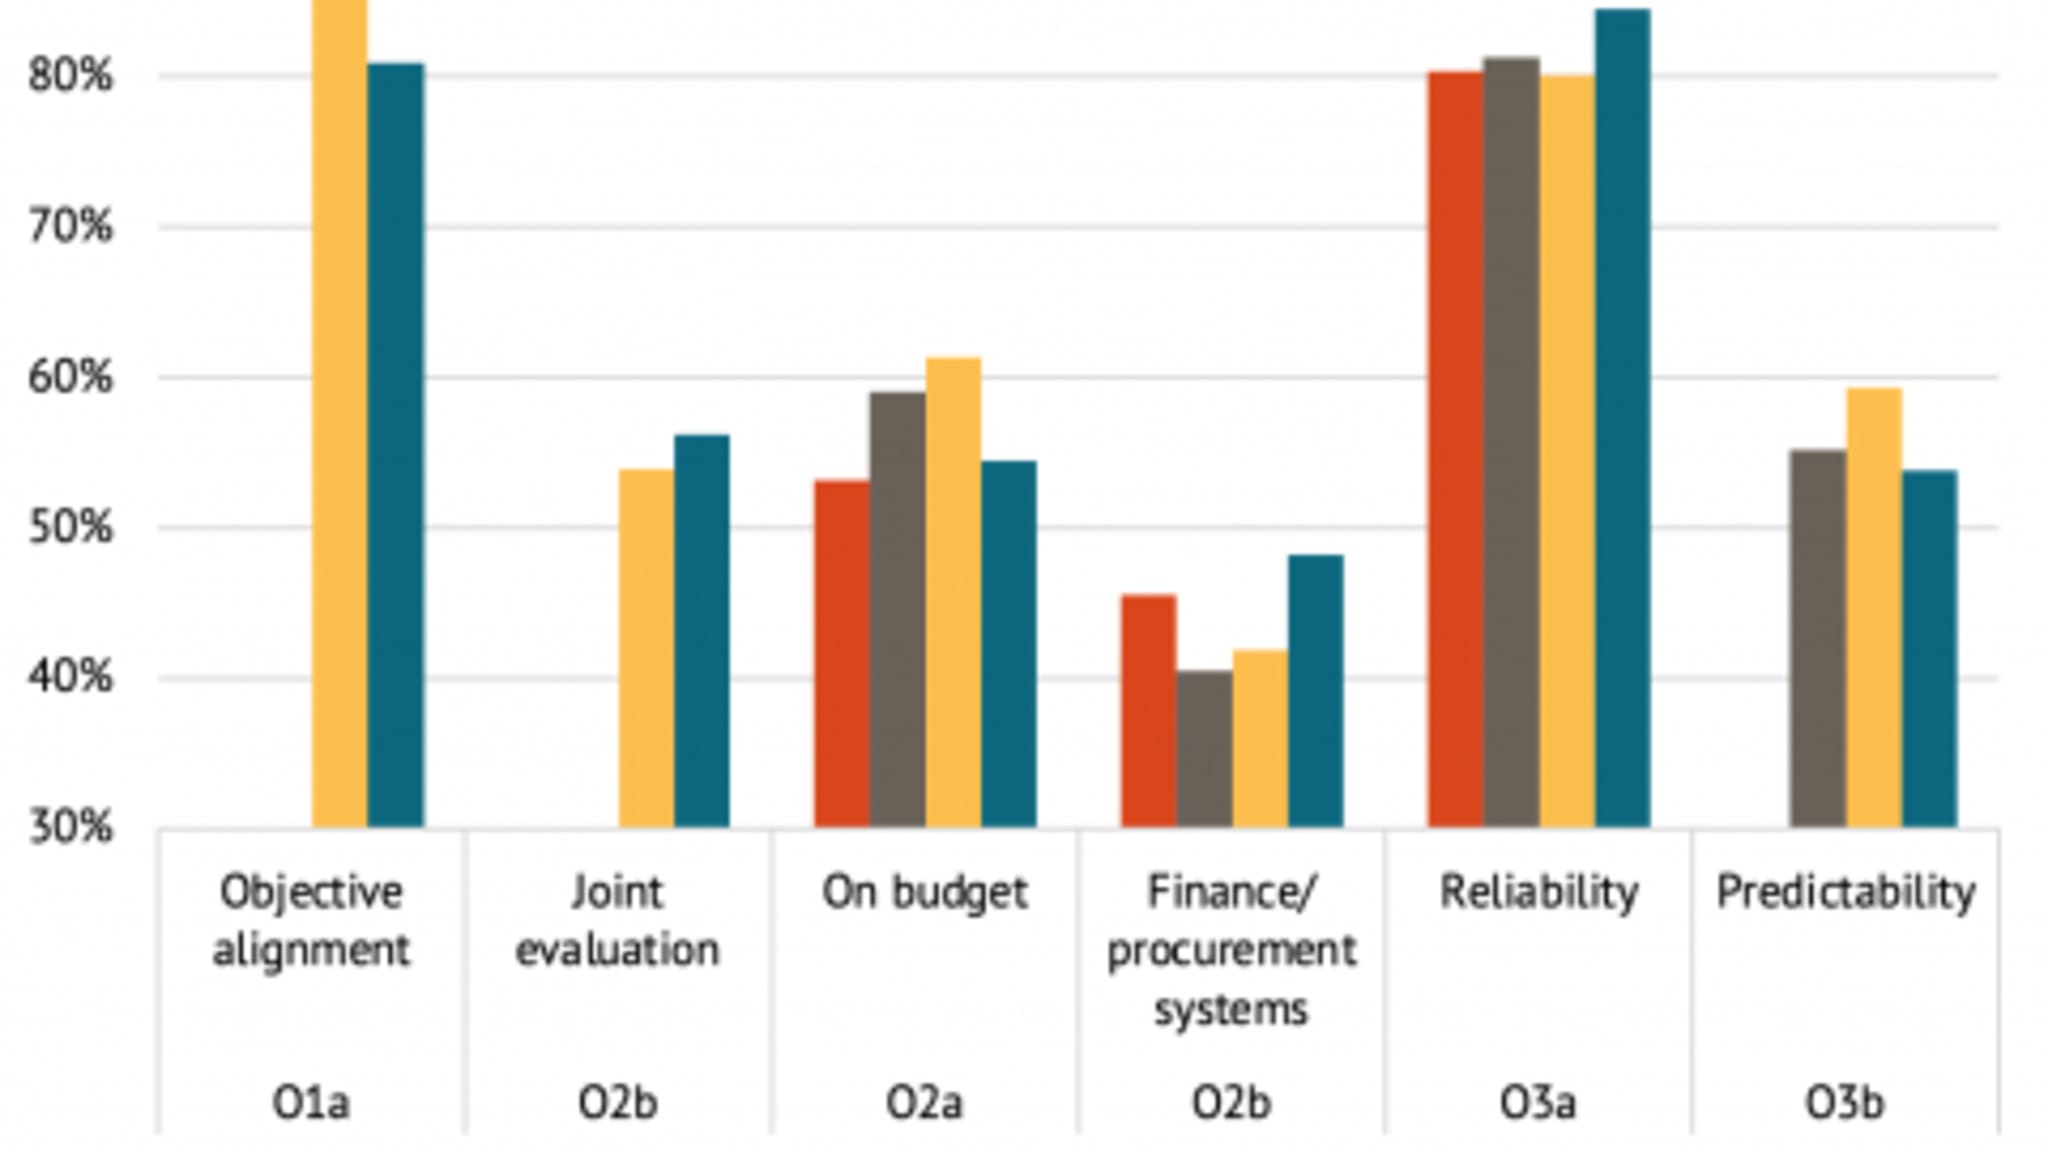
The graph below shows the scores of three ownership indicators (each with two subcomponents) averaged across all agencies for 2010, 2013, 2015, and 2017.
###3 Figure 4: Ownership Indicators, Average Across All Agencies
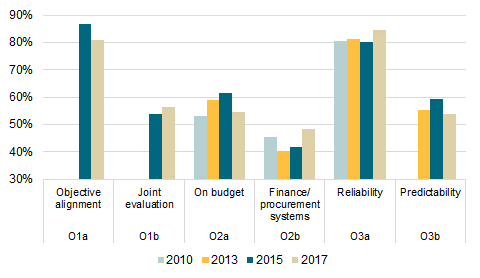
Source: Simple average of scores for QuODA agencies on GPEDC indicator 1a.1 (QuODA O1a), 1a.4 (QuODA O1b), 6.1 (QuODA O2a), 9b (QuODA O2b), 5a.1 (QuODA O3a) and 5b (QuODA O3b). See full QuODA methodology for full indicator definitions. Sample size differs across indicators and years based on data available.
Again, unfortunately, little movement is visible across the years studied for any indicator, implying that donors have not made many changes in their development assistance provision to improve partner ownership.
For the Ownership indicator, the GPEDC survey is the only systematically availible source, but the responses from development partners are incomplete, covering just some of the financing flows provided by donors assessed by QuODA, especially in earlier years. In 2017, the most recent year availible, the average share of ODA covered by GPEDC responses was 43% across the 49 providers CGD assesses.
Transparency and untying
Of the four QuODA indicators, progress is most encouraging along the axis of transparency and untying. The establishment and growth of the International Aid Transparency Initiative (IATI) has brought a substantial increase in the systemic availability of information on development projects. In 2019, 33 of QuODA’s 49 providers reported to IATI (up from 21 in 2009), with those sharing information on an average of 61% of their ODA, among those that did self-report to IATI (up from 46% in 2009). Improving transparency elevates the public’s faith in development projects- in both donor and partner countries- and helps minimize wasteful or corrupt spending: two concerns often raised by critics of the movement to increase global development funding.
Progress also looks promising on “tied” development assistance, or development funding provided to a partner country with restrictions in place requiring the partner to spend the funding on services delivered by the provider. In 2018, DAC members reported that 78% of their ODA was not tied to national companies - up from 74% in 2010.
However, in a new indicator, QuODA looks at the share of procured projects that are awarded to domestic contractors, and found that 57% of ODA contracts go to domestic contractors (the QuODA indicator adjusts this figure down according to the provider’s market share of global ODA contracts). It seems implausible that in over half of cases, the best-positioned organisation to deliver a project in a lower-income country is one in the high-income provider country. How much development impact are we sacrificing for this national bias? The research on this is relatively dated, but a rule of thumb is that tied assistance is a quarter less effective.
CGD was also surprised to learn that, while multilateral agencies generally do not ‘tie’ development assistance (indeed, this is one of the major benefits of disbursing ODA through multilaterals), the Asian and Islamic Development Banks do limit some of their procurement to their shareholder countries.
Evaluation
Providers of ODA are not solely responsible for every aspect of the outcome of the development projects they fund, but they do have control over how diligently they asses the success or failure of their projects and whether they alter future programming accordingly. Some ODA projects save hundreds or thousands of lives for relatively modest sums, while others achieve much less and cost much more. Evaluation and learning from projects, in collaboration with development partners, is crucial to development effectiveness.
There’s no existing quantiative measure of this capacity, so CGD compiled distinct measures of evaluation, learning and results-based management systems based on assessments by Development Assistance Committee (DAC) Peer Reviews for bilateral providers and Multilateral Organization Performance Assessment Network (MOPAN) assessments for multilateral agencies. These assessments were only quantified in QuODA’s most recent iteration, so CGD doesn’t yet have the data to identify trends overtime, but some interesting insights are nonetheless identifiable. While an assesment of the 42 providers’ scores from this year shows all but two providers have satisfactory evaluation systems, the data show that one in four providers could improve on learning or results-based management systems.
What's next?
Overall, QuODA’s quantitative measures over the last decade suggest some progress in one of the four dimensions (Transparency & Untying), but no sign of meaningful progress in two others (Prioritization and Ownership). There is room for growth on evaluation, too.
So, what can we do about it? We can - and should - push our ministers and governments to prioritize the conversation on ODA effectiveness. QuODA can help with that; officials and NGOs can use the results to propose improvements. QuODA’s online interface identifies donors’ areas of strength and weakeness and provides the hard data behind the assessments. With the Donor Tracker providing weekly updates on donors’ latest debates and commitments in development finance, readers can use scoring information from QuODA to advocate for the application of effectiveness principles at the most effective moments in policymaking and public debate.
Secondly, QuODA’s principles are not an abstract or solely retrospective concept; we can use them as a lens through which to examine contemporary conversations in global development. Take US President Biden’s new commitment to provide 500 million vaccines to low- and lower-middle income countries: we can ask, will they be provided to those most in need? Will the provision be conducted in collaboration with partner countries? Will the supplies be provided transparently, and untied from US suppliers? Will the US evaluate the effectiveness its approach to inform its response to future pandemics?
Finally, as provider countries mark the ten year anniversary of the Busan Agreement this autumn, they must re-double their commitments to ODA effectiveness. Readers can expect to hear more from CGD on this topic in the coming months, but at the very least, this recommitment would mean a recognition from advanced economy providers that they must meet a higher standard in their ODA provision; providing further improvements in the quality of information on ownership, and making meaningful, specific commitments to elevating the effectiveness of their ODA, rather than offering vague, rhetorical support for the principles.
The effectiveness of ODA can vary from saving thousands of lives in the poorest places in the world, to having almost no impact despite a formidable price tag. Provider-level indicators like QuODA are only one way to assess effectiveness, but as we recover from the pandemic and strive to reach the Sustainable Development Goals in the next nine years, we need more consistent focus on this topic. For years, politicians have talked about doing more with less; if we are serious about putting our dollars to work changing and even saving lives, we cannot afford to ignore a decade of lessons learned in ODA effectiveness.


Related Publications
Feminist Foreign Policies and development finance: A primer on practical applications
ODA Effectiveness
Donor Tracker Webinar featuring the Center for Global Development and the Kenyan Treasury on Evaluating ODA Effectiveness
Be the first to know. Get the latest in development news, right in your inbox.
The Donor Tracker team and network of in-country experts help advocates drive sustainable impact with regular Policy Updates, data-driven analyses, and the most important news in the world of development.
By clicking Sign Up you're confirming that you agree with our Terms and Conditions.
an initiative by SEEK Development